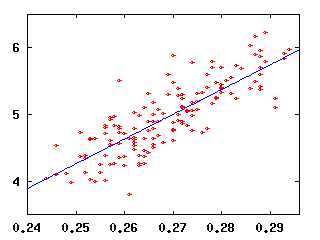
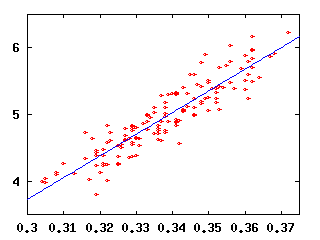
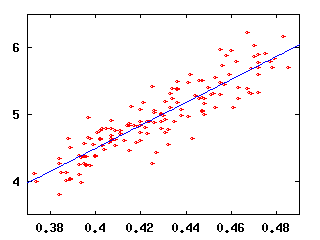
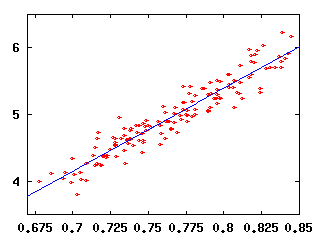
Let's look at all the major league teams from the past 5 years (1996-2000), which gives us a total of 146 team-seasons. For each team-season, I plot their average runs per game versus, say, their batting average. If batting average is important, then we should see an increase in runs per game with increasing batting average. We do. We see an increase with runs plotted versus OBP, SLG, and OPS also.
| Runs versus BA, R2=0.672 | Runs versus OBP, R2=0.835 |
 |
 |
| Runs versus SLG, R2=0.804 | Runs versus OPS, R2=0.900 |
 |
 |
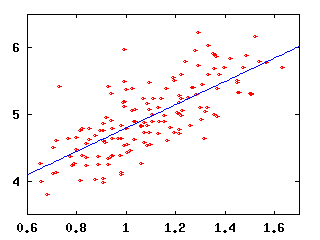
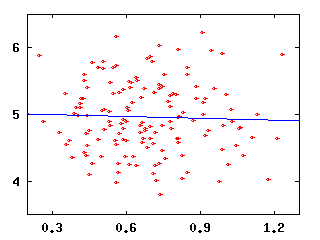
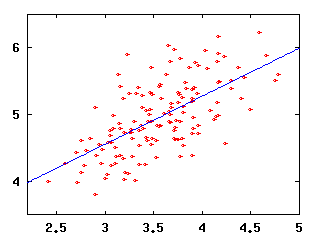
But which line gives the best fit is a separate issue from how well the line fits. Notice the OPS data are "tighter" on the line than the BA data. It appears that the OPS data are in some sense better described by the blue line than the BA data are. To make this point better, let's look at some more plots.
| Runs versus HR, R2=0.542 | Runs versus SB, R2=0.001 |
 |
 |
| Runs versus BB, R2=0.404 | Runs versus SO, R2=0.078 |
 |
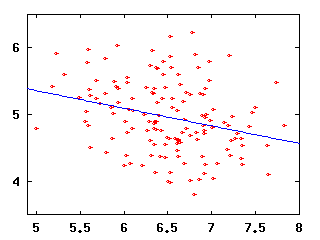 |
Now, why are these plots interesting? Well, suppose you knew only one thing about a team, say its batting average. How well could you predict their runs scored? Because the runs versus BA data are less like a line than the runs versus OPS data, we can conclude that knowing a team's OPS will tell us more about their runs scored than knowing their BA will.
So what? If we want to know a team's runs scored, why not just look their runs scored? The reason is because we want to understand which stats tell us about individual players' contribution to runs scored. Some individual stats like runs scored or RBI are ignored by modern analyists, because they depend too strongly on things beyond a player's control (if only Harry Chadwick had only introduced RBI divided by RBI opportunity...). But BA and OBP and so on are largely under a player's control. If we find one of these truly individual stats to correlate very well with team runs scored, then we can have some confidence that we can use this stat to assess the individual's contribution to the team.
Okay, that last paragraph was a quick run through the most important concept in modern baseball analysis. Let's consider an example. The plots above show that BA correlates better with runs scored than homers. Does that mean Tony Gwynn is a more valuable player than Mark McGwire (the pre-2001 versions)? Of course not, for two reasons. One is because McGwire is about a lot more than just homers. He has a better OBP than Gwynn and a considerably better SLG or OPS, all of which are more important than BA. The second reason is because McGwire dominates homers by a considerably larger factor than Gwynn dominates BA.
There is an important lesson here: if you want to assess a player's run production, you need to look at their rate for ALL the possible outcomes of a PA (that is: K, BB, single, double, triple, homer, HBP, Sac, SF, other outs) plus maybe some baserunning measures, and weigh these by their importance (K's don't matter much, homers matter more than singles, etc). There is a proper statistical way to do this: instead of trying to fit runs scored to a single stat like homers, you instead let the horizontal axis be a weighted sum of homers, bb, K's, etc, and then derive the weighting that gives you the best possible R2, or as statisticians put it, the combination which "explains the variation in runs scored" the best. This is called, for no particularly good reason, a "multiple regression." It has been done for baseball run scoring, and the results are basically Pete Palmer's Linear Weights system available in Total Baseball.
But, there is another option. Instead of trying to get the optimal combination of stats, you can look at various existing composite measures, like BA (combines all types of hits, chooses to ignore walks), OBP, SLG, OPS, etc, and just see which of them is doing the best job at explaining the variation in runs scored. Of the four just mentioned, OPS is the best, as you can see for yourself by eye. There are composite stats that do better than OPS, like Clay Davenports EqA, but they don't do a whole lot better and OPS is a lot easier to calculate. So the real reason I think McGwire blows away Tony Gwynn as an offensive player is because of his OPS.
A final comment on OPS as a player evaluation tool: it does what it's supposed to do very well, namely to explain how much an individual has contributed to their team's runs. But it is a ballpark dependent stat. The Rockies score a lot of runs, and Todd Helton is a big part of why they score them, so it's no surprise that his OPS is excellent. But his home/road splits for OPS show that he's a much more productive hitter at home - no surprise, some of his productivity is due to his hitting environment. So this creates a limitation in using OPS to compare players who play in different hitting environments. There are two solutions to this: one is to look at road OPS, which is nearly the same environment for everyone, and the other is to use more sophisticated stats like EqA, which are "ballpark adjusted".
See, it's not such an alphabet soup after all (or maybe it is...but for a good purpose).
This page maintained by Ben Vollmayr-Lee