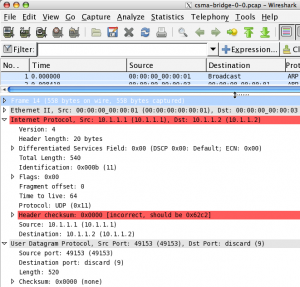
The ns-3 tutorial indicates that you can inspect the pcap files generated by simulations using two different tools: tcpdump and Wireshark (see section 5.3.2 Pcap Tracing).
Since tcpdump is a Unix tool that you’re most likely to find in your installation, let’s start there (tcpdump normally lives in /usr/sbin). The tutorial recommends you to open your pcap files using the following command line:
tcpdump -nn -tt -r filename.pcap
Where filename.pcap is obviously the name of a pcap file generated by some experiment. A quick look at the man page for tcpdump will tell you that the command line flags used above have the following meaning (quoted directly from Mac OS 10.5.8):
-n“Don’t convert addresses (i.e., host addresses, port numbers, etc.) to names.” This is the ideal choice in viewing simulation output because real world names won’t mean anything in the analysis of your experiment, where you address nodes by internal ns-3 identifiers or IP addresses. I haven’t been able to discover if there’s a difference between-nnand-n; both work the same way for me.-r“Read packets from file (which was created with the -w option). Standard input is used if file is “-”.” Another obvious choice, since what you’re looking at is a packet trace that’s been recorded to a file.-tt“Print an unformatted timestamp on each dump line.” The alternatives here are-t, which shows no timestamp on each line, or-ttt, which shows a time increment relative for the preceding line, or yet-tttt, which would precede timestamp by a date (the canonical Jan. 1st, 1970) that is meaningless to your experiment.
Bottom line: use the recommended flags. Running this on a pcap file generated by an ns-3 simulation would give you output such as:
1.008192 arp who-has 10.1.1.2 (Broadcast) tell 10.1.1.1
1.016602 arp reply 10.1.1.2 is-at 00:00:00:00:00:03
1.016602 IP 10.1.1.1.49153 > 10.1.1.2.discard: UDP, length 512
1.017515 IP 10.1.1.1.49153 > 10.1.1.2.discard: UDP, length 512
...

While tcpdump might suffice for many use cases, using Wireshark gives more detail through a very usable GUI. If you have it in your system, give it a spin, if not, it’s easily available for Windows and Unix systems (you can get binaries for Mac OS X >= 10.5.5, otherwise you need to use MacPorts). It’s a great application to capture packets on a live network, but also to analyze pre-recorded pcap traces. The added value in using Wireshark on ns-3 pcap traces is that you can inspect those nested protocol data units in all their glorious details. The screenshot provided here should give you a taste of it.
This is all fine and dandy, you say, but the question is: how can I make my simulation run generate a packet trace? The honest answer is that simulation runs don’t generate the pcap traces by default (remember that I/O has a performance cost?) At the same time, it’s nearly trivial to make it happen. Say that you have created an instance of a helper for the device in your network model. All you’d have to do is use this instance to call methods like EnablePcap or EnablePcapAll before starting the simulation run. For more details, you should check out the documentation for the ns3:PcapHelperForDevice class, which in inherited by the various device helper classes. If you want to see examples of code that enable pcap trace generation, change directory to the root of your ns-3 installation and run:
grep -r "EnablePcap" examples/
