Susquehanna River Initiative
Bucknell University Environmental Center
Mapping the landscape
Creating accurate digital terrain models using GPS and GIS
Janine Glathar, GIS Specialist
Rob Jacob, Assistant Professor of Geology
Rob Jacob, Assistant Professor of Geology
Precise topographic data as digital elevation models (DEMs) are necessary for estimating flood zones and wetland designs. In addition, these data may be used to estimate construction costs and necessary construction equipment. The available DEM from airborne LIDAR provides an average topography from a square meter of the ground surface and has a reported precision of ~0.5 m.
Using a real-time kinematic GPS (RTK-GPS) system and a robotic total station, elevation and surface features were mapped along Miller Run by GIS student interns during the 2011 summer with precisions of <0.01 m and at a resolution of <0.5 m2 over much of the project area.
In August 2011, a team of GIS Student Assistants under the direction of Prof. Rob Jacob and GIS Specialist Janine Glathar started data collection for the Miller Run Restoration Project. The two phases of the work included 1) general DEM creation in the Abby Lane section of Miller Run – a large oat field adjacent to the driving range at the Bucknell golf course – and along the floodplain of Miller Run between the Day Care and Rte 15 and 2) high-resolution topographic data of the banks and stream profile.
One group of students collected continuous topographical measurements with the mobile RTK-GPS unit while a second team used the total station to collect coordinate and elevation data along Miller Run.
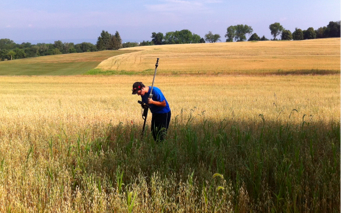
Max Stiss collects high-resolution topographic data near Abbey Lane using robotic total station. July, 2011
The students made the following observation after the first week of work. “Actually using the equipment to get measurements is fairly simple. The aspect that we spent the most time learning was setting up the equipment and getting it ready to record data. On that first day it took us 30-45 minutes to set up the Total Station, but now it only takes 5-10 minutes.”
The survey of the banks and in the stream involved careful work by the team of students. Although the stream bed was almost completely dry at that point in the summer the surrounding banks were overgrown with vegetation.
Two students were tasked with collecting data while the other two cleared a path ahead. Faculty involved in the Miller Run Restoration project visited students in the field to offer guidance, encouragement and advice. During one such trip to the field,
Prof. Duane Griffin pointed out native plants along the river banks and advised students to spare those plants during the ‘bushwhacking’ so that they could be included in the planned wetlands restoration work.
The continuous topo, stream profile and cross-section data collected by the GIS Student Assistants was processed and mapped in ArcGIS and then packaged into geodatabases along with other basemap data of interest – including a comprehensive collection of CAD data provided by Bucknell’s Facilities group - for the Miller Run area. The geodatabases and project metadata were disseminated in early fall 2011 to faculty from BUEC, geology, geography, biology, environmental studies and other departments to use in their Miller Run planning & design work.
The continuous topo, stream profile and cross-section data collected by the GIS Student Assistants was processed and mapped in ArcGIS and then packaged into geodatabases along with other basemap data of interest – including a comprehensive collection of CAD data provided by Bucknell’s Facilities group - for the Miller Run area. The geodatabases and project metadata were disseminated in early fall 2011 to faculty from BUEC, geology, geography, biology, environmental studies and other departments to use in their Miller Run planning & design work.
Watershed modeling
Integrating GIS data and HSPF numerical hydrologic and water quality modeling tools
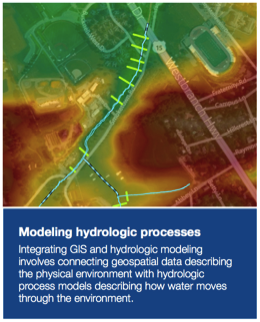
Future GIS hydrologic modeling studies are now being considered by students. The geospatial data in the GIS framework can be integrated with the hydrologic data and finite-element numerical models (e.g., HEC-RAS) to simulate water flow and quality changes through the watershed. Observed time series of stream gage records can be used to calibrate the model, which can then be used to predict how the stream may respond to various changes to geomorphology, climate, and land use.
The high-resolution elevation data collected by the summer GPS surveys is being composited with LIDAR and DEM data from the USGS to create a digital terrain model (DTM) with the ArcGIS system. These data represent a digital model of the watershed’s slopes, which can be combined with digital maps of the soils, and channel features to create a hydrography model of the Miller Run watershed, which can then be coupled with rainfall and land cover parameters to refine the runoff calculations, flood hydrograph and sediment erosion estimates.