Susquehanna River Initiative
Bucknell University Environmental Center
Flow in the Susquehanna River
Click to enlarge graph
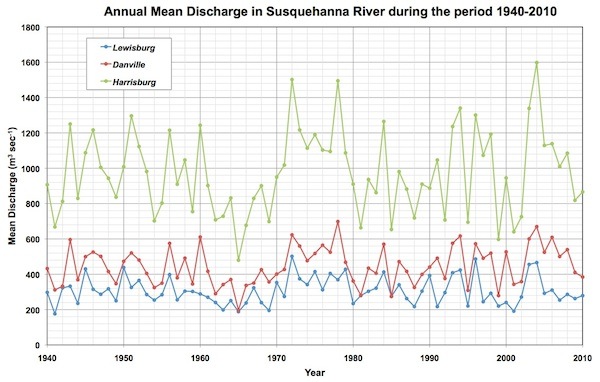
Variability in monthly mean discharges (m3 sec-1) for the period 1940 through 2010 at three locations in the watershed: (1) West Branch at Lewisburg, PA (blue line), (2) North Branch at Danville, PA (red line), and (3) main stem Susquehanna River at Harrisburg, PA (green line). Discharges shown on this graph are based on monthly flow statistics published online by the U.S. Geological Survey. Droughts of 1941 and 1965 were significant, followed by regular low flow conditions in 1981, 1988, 1992, 1995, 1998, and 2001. The impacts of Tropical Storm Agnes and Hurricane Ivan are evident in the high monthly mean discharges for years 1972 and 2004 respectively.
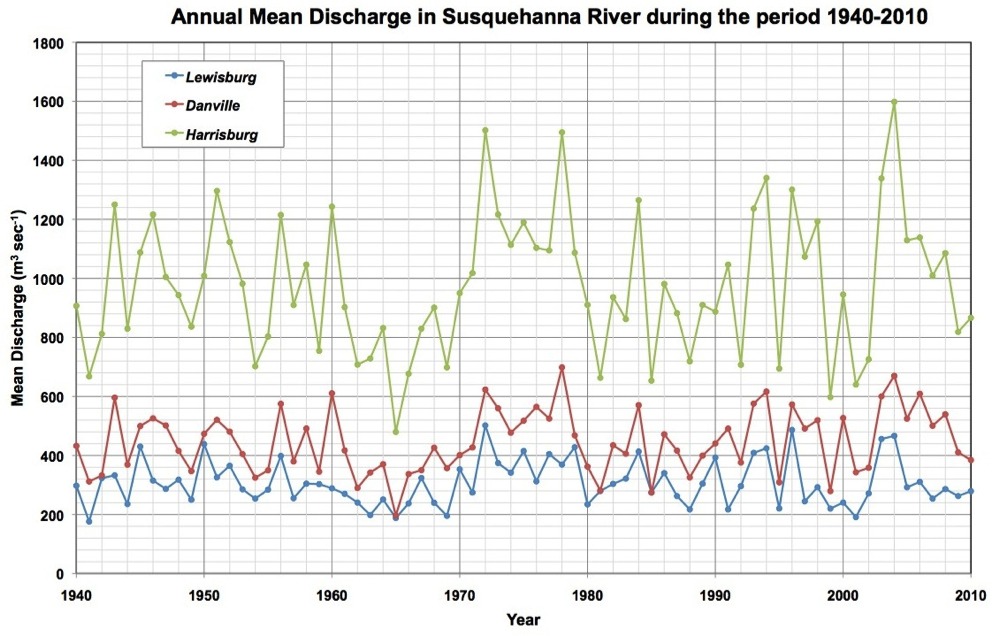
Variability in monthly mean discharges (m3 sec-1) for the period 1940 through 2010 at three locations in the watershed: (1) West Branch at Lewisburg, PA (blue line), (2) North Branch at Danville, PA (red line), and (3) main stem Susquehanna River at Harrisburg, PA (green line). Discharges shown on this graph are based on monthly flow statistics published online by the U.S. Geological Survey. Droughts of 1941 and 1965 were significant, followed by regular low flow conditions in 1981, 1988, 1992, 1995, 1998, and 2001. The impacts of Tropical Storm Agnes and Hurricane Ivan are evident in the high monthly mean discharges for years 1972 and 2004 respectively.
Monthly mean discharges in the Susquehanna River
The table below reports monthly mean discharges (m3 sec-1) for Susquehanna River at Lewisburg, Danville, and Harrisburg for the period 1940 through 2010. As you move your mouse over the table, you can scroll up and down to peruse the records. You can also sort the records in ascending or descending order by clicking on the "up" or "down" triangles next to each column header. You can search for discharges for a given year using the search box. You can also click and drag over various records to select and copy them into your clipboard, which you can then paste into a spreadsheet or text table.
Data are based on hydrologic records (ft3 sec-1) published online by the U.S. Geological Survey. Longer-term discharge records are available at the sites shown in the upper right corner of this page.
Data are based on hydrologic records (ft3 sec-1) published online by the U.S. Geological Survey. Longer-term discharge records are available at the sites shown in the upper right corner of this page.
Tables of monthly mean discharges for the Susquehanna River
Click on the one of the following locations to view complete series of discharge records at various locations in the Susquehanna watershed:
West Branch
 Lewisburg, PA (1940-2010)
North Branch
 Danville, PA (1906-2010)
Main Stem
 Harrisburg, PA (1891-2010)
West Branch
North Branch
Main Stem
| Year | Lewisburg | Danville | Harrisburg |
|---|---|---|---|
| 1940 | 297.6 | 432.4 | 907.0 |
| 1941 | 176.2 | 311.8 | 668.0 |
| 1942 | 323.4 | 332.4 | 812.1 |
| 1943 | 332.7 | 596.1 | 1250.2 |
| 1944 | 235.3 | 369.0 | 829.7 |
| 1945 | 430.1 | 499.8 | 1087.7 |
| 1946 | 315.2 | 525.8 | 1216.5 |
| 1947 | 286.8 | 501.5 | 1004.7 |
| 1948 | 318.0 | 415.4 | 943.2 |
| 1949 | 250.1 | 346.9 | 836.5 |
| 1950 | 438.3 | 473.5 | 1008.6 |
| 1951 | 325.6 | 520.7 | 1296.3 |
| 1952 | 365.3 | 480.5 | 1123.0 |
| 1953 | 285.4 | 404.9 | 982.0 |
| 1954 | 254.0 | 324.8 | 702.3 |
| 1955 | 284.3 | 349.7 | 803.1 |
| 1956 | 398.4 | 575.1 | 1215.1 |
| 1957 | 255.2 | 379.7 | 909.5 |
| 1958 | 304.7 | 491.3 | 1046.6 |
| 1959 | 303.0 | 345.2 | 754.6 |
| 1960 | 288.8 | 610.8 | 1243.1 |
| 1961 | 270.0 | 416.8 | 902.5 |
| 1962 | 240.4 | 290.0 | 707.9 |
| 1963 | 198.3 | 342.1 | 728.6 |
| 1964 | 250.9 | 370.4 | 831.9 |
| 1965 | 188.3 | 196.7 | 479.7 |
| 1966 | 237.7 | 337.0 | 677.1 |
| 1967 | 323.7 | 350.3 | 829.7 |
| 1968 | 239.7 | 426.5 | 901.0 |
| 1969 | 195.5 | 356.8 | 698.3 |
| 1970 | 353.1 | 401.2 | 950.0 |
| 1971 | 274.6 | 427.3 | 1018.0 |
| 1972 | 501.8 | 623.3 | 1501.9 |
| 1973 | 374.3 | 559.8 | 1216.5 |
| 1974 | 341.8 | 477.1 | 1113.7 |
| 1975 | 415.1 | 517.6 | 1189.9 |
| 1976 | 312.3 | 564.6 | 1103.2 |
| 1977 | 404.6 | 525.0 | 1094.7 |
| 1978 | 369.3 | 698.6 | 1494.8 |
| 1979 | 427.9 | 468.1 | 1086.8 |
| 1980 | 234.2 | 362.2 | 910.1 |
| 1981 | 279.7 | 281.1 | 663.2 |
| 1982 | 303.8 | 434.7 | 936.4 |
| 1983 | 321.7 | 405.8 | 862.0 |
| 1984 | 413.1 | 570.3 | 1264.9 |
| 1985 | 274.5 | 274.6 | 653.6 |
| 1986 | 340.4 | 471.8 | 981.2 |
| 1987 | 262.5 | 416.5 | 882.1 |
| 1988 | 217.3 | 325.4 | 719.0 |
| 1989 | 304.7 | 399.6 | 910.1 |
| 1990 | 393.0 | 440.9 | 887.2 |
| 1991 | 217.3 | 491.0 | 1046.6 |
| 1992 | 296.2 | 376.0 | 707.4 |
| 1993 | 408.9 | 575.7 | 1236.6 |
| 1994 | 424.2 | 616.7 | 1340.5 |
| 1995 | 220.6 | 308.9 | 694.6 |
| 1996 | 486.5 | 572.6 | 1300.9 |
| 1997 | 244.7 | 491.0 | 1073.2 |
| 1998 | 292.5 | 519.6 | 1193.0 |
| 1999 | 220.1 | 279.6 | 597.5 |
| 2000 | 240.5 | 527.0 | 945.5 |
| 2001 | 191.3 | 342.9 | 640.2 |
| 2002 | 271.5 | 358.5 | 725.8 |
| 2003 | 455.9 | 600.3 | 1338.8 |
| 2004 | 466.4 | 669.7 | 1598.2 |
| 2005 | 292.2 | 524.7 | 1129.0 |
| 2006 | 310.6 | 609.1 | 1138.6 |
| 2007 | 253.9 | 500.6 | 1009.2 |
| 2008 | 286.3 | 539.4 | 1085.4 |
| 2009 | 262.6 | 410.6 | 818.6 |
| 2010 | 279.3 | 384.5 | 866.5 |
Blank Row