Susquehanna River Initiative
Bucknell University Environmental Center
Monitoring water quality in the Susquehanna River
BENJAMIN R. HAYES, Director, Susquehanna River Initiative
MATTHEW E. McTAMMANY, Associate Professor, Department of Biology
SEAN P. REESE, Aquatic Ecologist, Bucknell Environmental Center
BENJAMIN R. HAYES, Director, Susquehanna River Initiative
MATTHEW E. McTAMMANY, Associate Professor, Department of Biology
SEAN P. REESE, Aquatic Ecologist, Bucknell Environmental Center
Click to enlarge photo
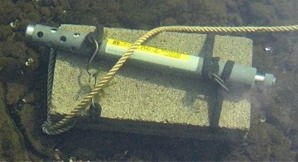
Figure 1. YSI multi-parameter water quality sonde secured to bottom of Susquehanna River to monitor diurnal and weekly variability in dissolved oxygen and temperature at selected locations in the Susquehanna River. This information is valuable to assessing fish habitat and limiting factors to ecological health during low flow periods.
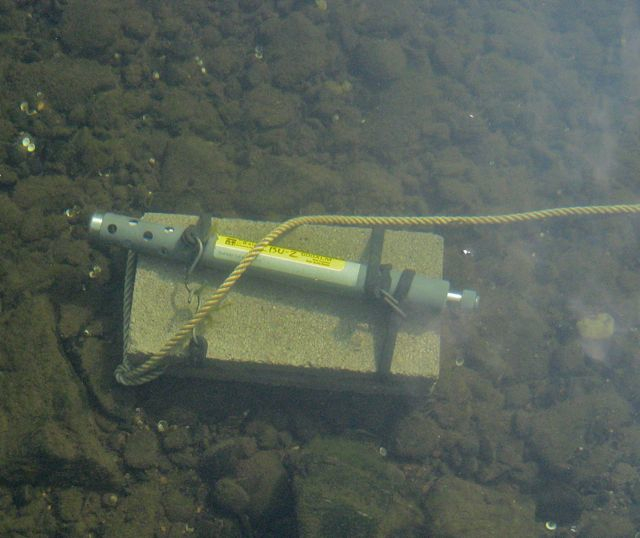
Figure 1. YSI multi-parameter water quality sonde secured to bottom of Susquehanna River to monitor diurnal and weekly variability in dissolved oxygen and temperature at selected locations in the Susquehanna River. This information is valuable to assessing fish habitat and limiting factors to ecological health during low flow periods.
In 2009, we partnered with the Susquehanna River Basin Commission to configure and install two YSI 6600 water quality sondes and telemetry data logger systems at water treatment plants on the West Branch near Milton and on the North Branch near Danville. Since then, the instruments have recorded fluctuations in water quality and are now part of the SRBC’s Early Warning System, which is used by a number of state and federal regulatory agencies to alert them to sudden changes in river conditions.
Each sonde is equipped with five interchangeable sensors which measure water depth, temperature, dissolved oxygen, pH, turbidity, oxidation-reduction potential, and chlorophyl. They receive monthly maintenance and calibration to ensure accurate data.
Anyone can view the time series and selected various water quality parameters. The website also has an interactive map that shows the locations of the sondes. Users can also view statistics and plots of the data, as well as download the raw data in Excel, PDF, and HTML tables.
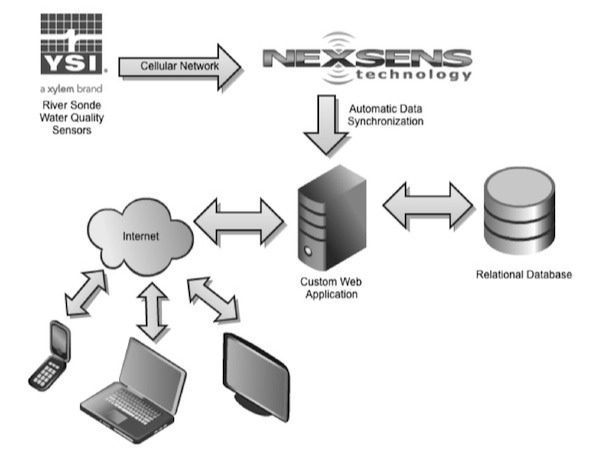
Figure 1. The data are stored on an internal datalogger in the YSI sonde (upper left and uploaded every 15 minutes via a cellular network and synchronized via Nexsense third-party software, which then is uploaded to a computer server at Bucknell. Custom software was written to store the data in a MySQL database (right) and display the real-time data feeds in an interactive web portal on the Initiative’s web site (see Figure 2 below).
Click to view real-time water quality data
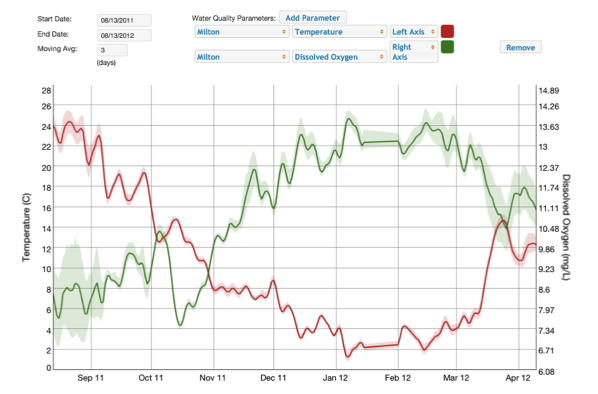
Figure 2. Bucknelll scientists have developed new web-portal software which displays time series of water quality conditions at selected locations in the Susquehanna watershed. This examples shows water temperature (red) and dissolved oxygen levels (green) in the West Branch at at Milton, Pennsylvania.
CLICK ON THE CHART TO VIEW REAL-TIME WATER QUALITY DATA IN AN INTERACTIVE WEB PORTAL
Figure 2. Real-time time series of water quality readings at Milton or Danville monitoring stations. The shaded areas around each line indicate the range (min and max) in readings for that day. As you move your cursor over the lines, the actual values are displayed in the upper right hand portion of the window. You can select various time periods or simply drag your mouse over the graph to "zoom" into a selected window of time.
Figure 2. Real-time time series of water quality readings at Milton or Danville monitoring stations. The shaded areas around each line indicate the range (min and max) in readings for that day. As you move your cursor over the lines, the actual values are displayed in the upper right hand portion of the window. You can select various time periods or simply drag your mouse over the graph to "zoom" into a selected window of time.
The Initiative also has uses several "roving" sondes at other locations in the watershed. During the summer of 2009, two sondes were deployed for several months below Sunbury and documented that even below the confluence the waters from the North and West branches do not mix.
This water quality monitoring network is opening new doors for Bucknell students and for collaboration and research with other universities and state and federal agencies. The Initiative hopes to expand its network to include live river cams and additional water quality sondes placed in the river below the confluence and up the West and North Branches.
Preliminary results of the river water quality network have been presented at the annual meeting of the North American Benthological Society and the American Society of Civil Engineers’ Hydraulic Measurement and Experimental Methods Conference.
REAL-TIME WATER QUALITY DATA
Figure 3. Custom software was also written to allow users to query the water quality database and have it render the data as a portfolio view, similar to a stock market portfolio, where colors and shading are used to indicate relative
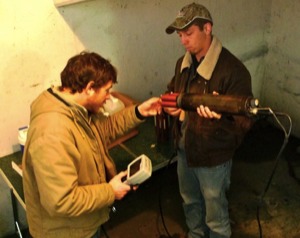
Figure 4. Regular maintenance and calibration of the sondes ensure accurate readings.